35,000 Hours: What Your Child's Screen Time Looks Like Before They Turn 18

Key Findings
- 35,000 hours of entertainment screen time before age 18. That is almost three times the ~13,000 hours children spend in K-12 classroom instruction.
- More than everything else combined. Entertainment screen time exceeds school, outdoor play, reading, organized sports, family meals, and homework put together.
- Enough to master three skills at world-class level. 35,000 hours equals 3.5 times the 10,000 hours Malcolm Gladwell popularized as the threshold for expertise.
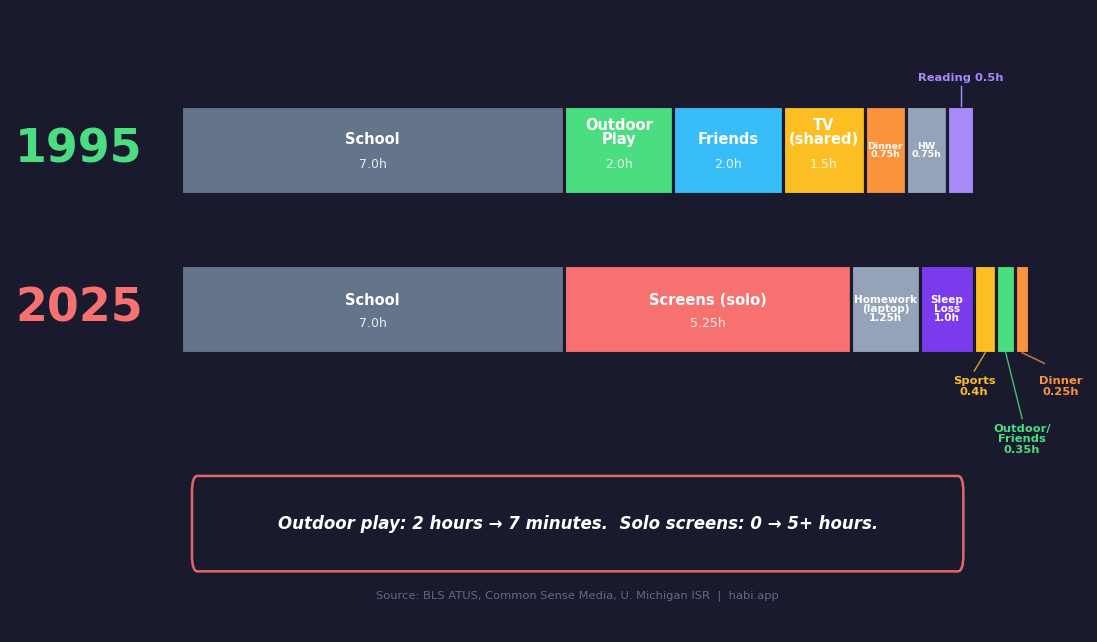
- Outdoor play collapsed from 2 hours to 7 minutes per day. Teens who see friends in person daily dropped from 52% to 28% in one generation.
- 80% of teens in South Korea and Singapore are now nearsighted. Each additional hour of daily screen time raises myopia risk by 21%, according to a 2025 JAMA meta-analysis of 335,524 individuals.
- Parents spend 7x more time on personal screens than talking to their kids. 54% of children say their parents check phones too often.
We wanted to answer a simple question: how much of childhood, measured in raw hours, goes to screens? Not a feeling. Not a guess from a parenting blog. The actual number, calculated from the largest datasets on children's media use that exist.
So we pulled Common Sense Media's census reports, cross-referenced them against Bureau of Labor Statistics time-use data, and compared cumulative entertainment screen time from birth through age 18 against every other major childhood activity we could find reliable numbers for. School. Outdoor play. Reading. Sports. Family meals. Homework.
The number is 35,000 hours.
That is almost three times the total hours of K-12 classroom instruction. It exceeds school, outdoor play, reading, sports, family meals, and homework combined. And 86% of it is passive consumption, not learning, not creating, just watching and tapping. (Want to see the number for your child's age? Try our screen time calculator.)
What We Did
The screen time data comes from Common Sense Media's 2021 census for tweens and teens (ages 8-18) and their 2025 census for children ages 0-8. These are the gold-standard datasets for children's media use in the United States, probability-based, nationally representative, and the ones most cited in peer-reviewed research.
One critical detail: these figures cover entertainment screen time only. Schoolwork on Chromebooks, homework on Google Docs, Zoom classes during a snow day. None of that is counted. The 35,000 hours is pure entertainment. TikTok, YouTube, Netflix, Roblox, Instagram, gaming, texting.
For the comparison activities (school, outdoor play, reading, sports, family meals, homework), we drew on the Bureau of Labor Statistics American Time Use Survey, NCES school hours data, and published research on each activity. Every number, every source, and every calculation is documented in the full methodology at the bottom of this article.
How Much Screen Time Do Children Actually Get?
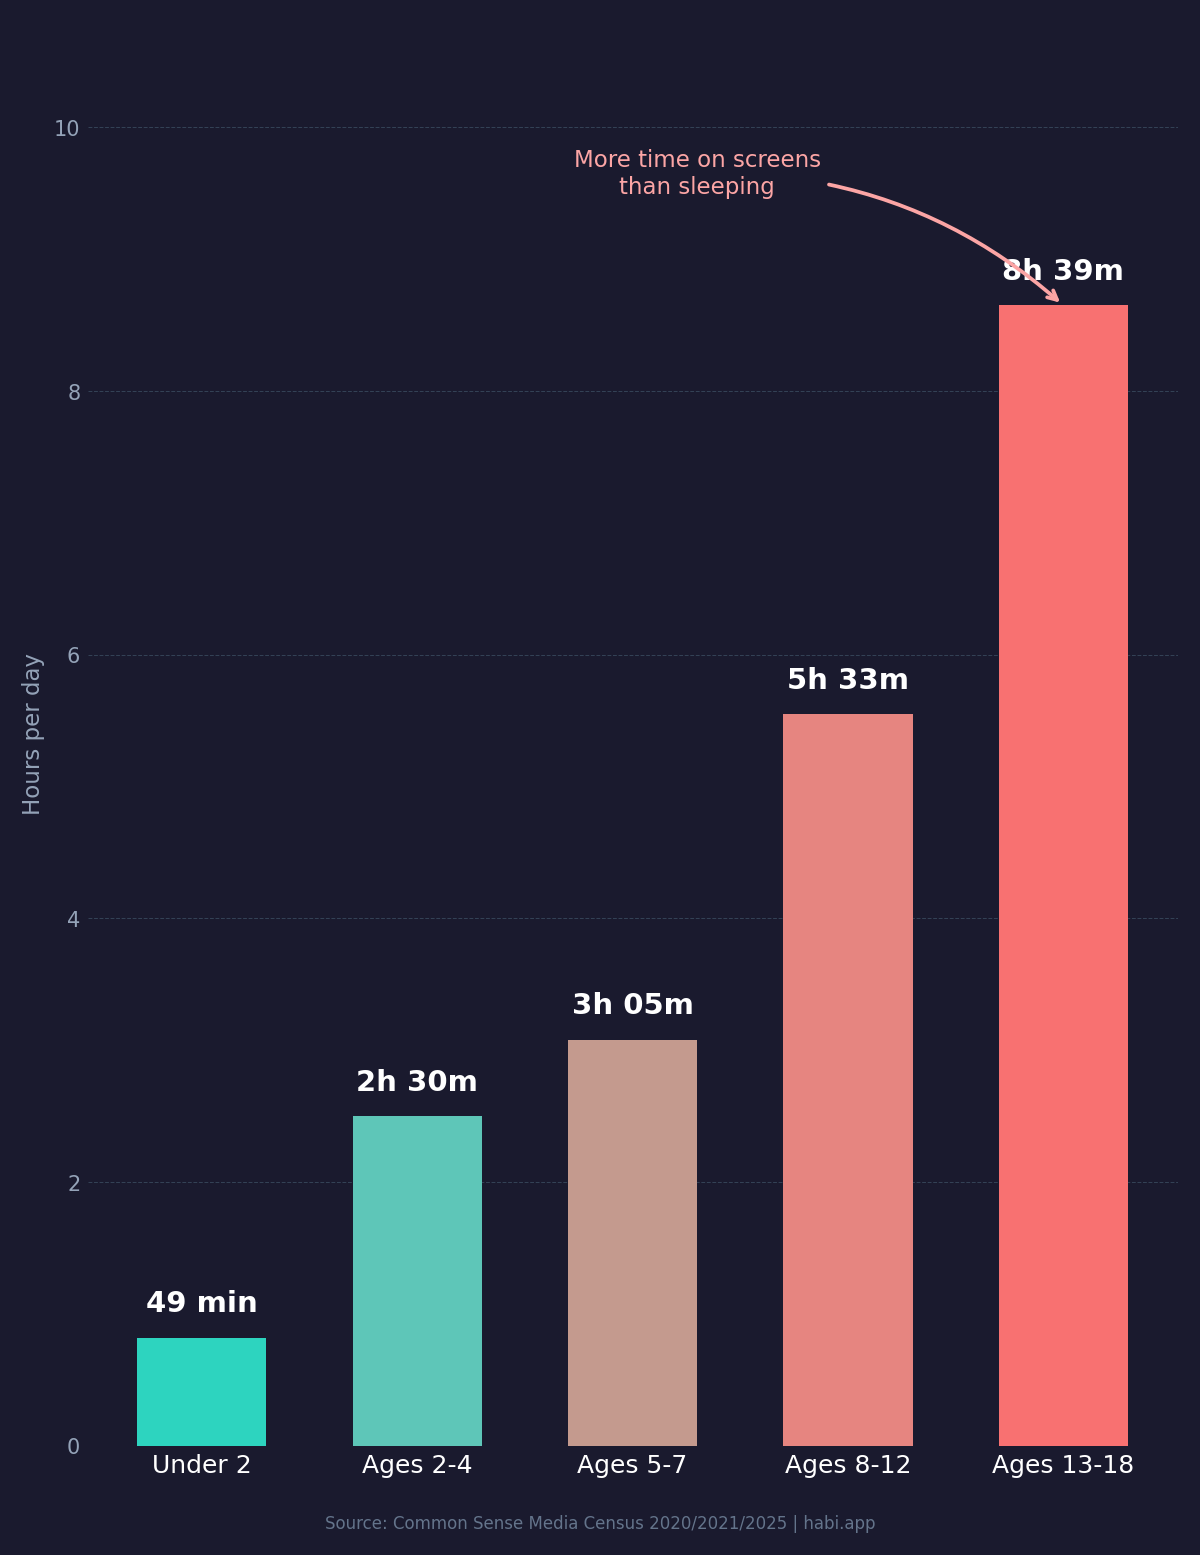
The escalation by age is what catches you off guard. A two-year-old watches 49 minutes a day and that feels manageable, maybe even reasonable if it buys you enough time to cook dinner. But the number does not stay at 49 minutes. By the time that same child turns thirteen, the daily average hits 8 hours and 39 minutes of entertainment media, which is more time than most adults spend at their jobs.
| Age Group | Daily Average | Annual Total | Cumulative by End of Bracket |
|---|---|---|---|
| Under 2 | 49 min | 299 hours | ~600 hours |
| Ages 2-4 | 2h 30m | 913 hours | ~3,300 hours |
| Ages 5-7 | 3h 05m | 1,125 hours | ~6,700 hours |
| Ages 8-12 | 5h 33m | 2,026 hours | ~16,800 hours |
| Ages 13-18 | 8h 39m | 3,157 hours | ~35,000 hours |
Source: Common Sense Media Census 2025 (ages 0-8), Common Sense Media Census 2021 (ages 8-18).
Almost Three Times More Than School
K-12 classroom instruction totals roughly 13,000 hours across thirteen years, using OECD and NCES averages of about 1,000 instructional hours per year. That is the number most parents picture when they think about where childhood goes. Desks. Whiteboards. The smell of dry-erase markers.
Entertainment screens get 35,000 hours.
Almost three times as much. And even if you use the most generous school estimate, counting every minute inside the building including lunch and recess and assemblies, you get about 16,000 hours. Screens still win by more than double.
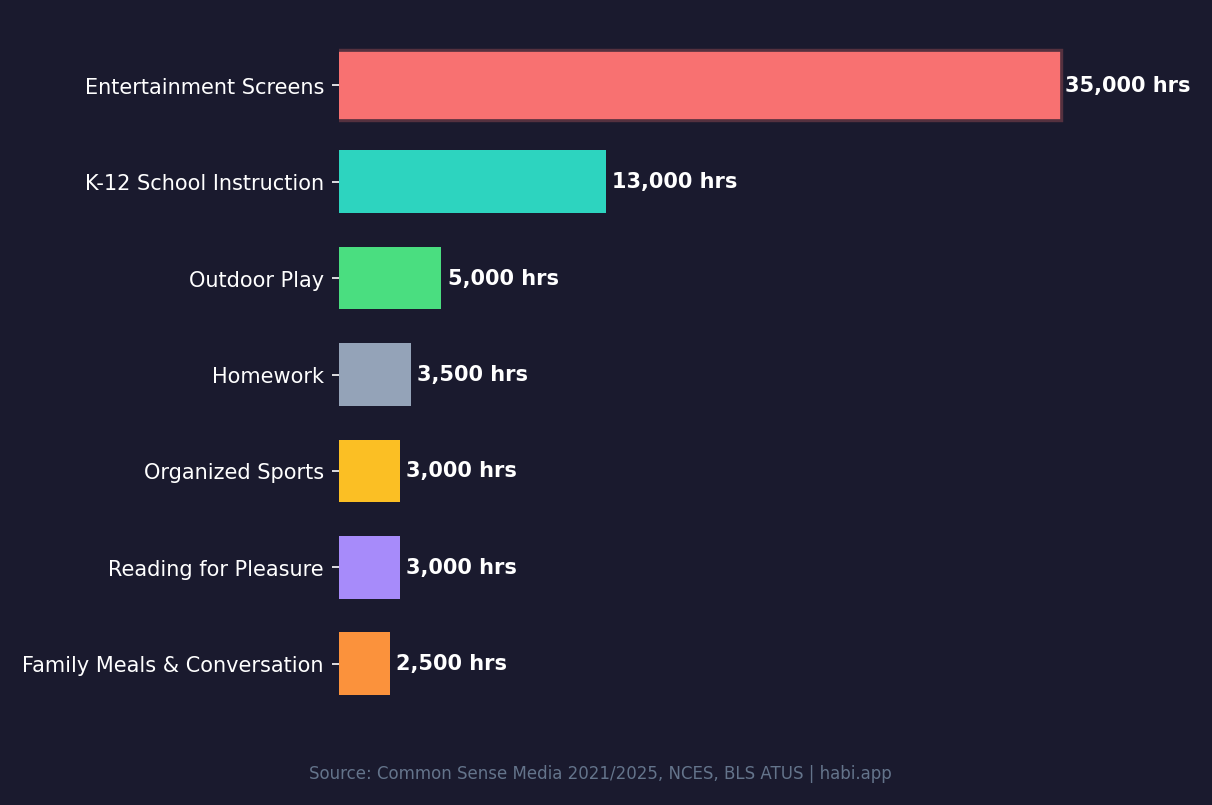
More Than Everything Else Combined
This is the comparison that made us rebuild the chart twice because we assumed we had a formula error.
| Activity | Estimated Total Hours | Primary Source |
|---|---|---|
| Entertainment screens | ~35,000 | Common Sense Media 2020/2021/2025 |
| K-12 classroom instruction | ~13,000 | NCES / OECD |
| Outdoor play | ~4,000-6,000 | U. Michigan ISR, BLS ATUS |
| Homework | ~3,500 | NCES Digest of Education Statistics |
| Face-to-face time with friends | ~3,000-5,000 | BLS ATUS, Twenge et al. |
| Reading for pleasure | ~2,500-3,500 | Common Sense Media, NEA |
| Organized sports | ~2,000-4,000 | Aspen Project Play, CDC |
| Family meals & conversation | ~2,000-3,000 | CASA Columbia, Gallup |
Add them up. School plus outdoor play plus reading plus sports plus family meals plus homework comes to about 30,000 hours at the upper end of the estimates.
Entertainment screens still exceed the total.
A child born today will spend more of their waking childhood watching entertainment on a screen than doing every other non-sleep activity in their life, combined. That sentence felt wrong when we first wrote it. We checked the math four times. It holds.
What Did Children Lose to Screens?
The 35,000 hours came from somewhere. They displaced something. Several somethings.
"The issue of screen time is not so much that screen time is inherently toxic so much as what it displaces," said Dr. Michael Rich, pediatrician and director of the Digital Wellness Lab at Harvard Medical School. "What we are not doing because we're on a screen. We are not taking a walk in the woods or having a conversation with our parents." The displacement framing is the one that keeps showing up in the data.
The Activities That Shrank
Outdoor play dropped by at least 50%. The University of Michigan's Institute for Social Research tracked children's time use over two decades and found unstructured play cut roughly in half. Other estimates put the current daily average for younger children at 4 to 7 minutes. That is less time than a prisoner gets in a maximum-security exercise yard.
Seven minutes.
Reading for pleasure nearly halved. The National Endowment for the Arts reported that only 14% of 13-year-olds read for fun "almost every day" in 2023. In 2012 that number was 27%. BLS data for teens ages 15-19 shows less than 9 minutes of daily reading for pleasure, which is not enough to finish a single chapter of anything before putting the book down.
In-person friendships collapsed. Among 12th-graders, the share who see friends in person "almost daily" went from 52% in the late 1970s to 28% by 2017, according to Twenge's analysis of Monitoring the Future data. A 46% relative decline. Eighth-graders' weekly social outings fell 40% between 2000 and 2021. The friendships did not disappear exactly. They migrated to Snapchat streaks and Discord servers, which is a different kind of presence, the kind where you are always technically available but rarely actually together.
Kyung Hee Kim, Professor of Educational Psychology at the College of William & Mary, analyzed 300,000 Torrance Test scores across three decades. The scores have been falling since 1990. Her conclusion: children have become "less emotionally expressive, less energetic, less talkative, less humorous, less imaginative, less unconventional, less lively and passionate, less perceptive, and less apt to connect seemingly irrelevant things."
That is not a single metric declining. It is the entire creative profile narrowing.
The Five-Day Reversal
But this is the part that matters most. A 2014 UCLA study by Yalda Uhls sent preteens to a screen-free nature camp for five days. Five days without phones, without tablets. The children significantly improved their ability to read nonverbal emotional cues in faces and video. The control group, with normal screen access, showed no change at all.
Five days. The displacement is real but it is not permanent. The wiring is still there, underneath.
What Could 35,000 Hours of Practice Produce?
Malcolm Gladwell popularized the idea that 10,000 hours of deliberate practice produces world-class expertise. The actual research, from Anders Ericsson's 1993 study of violin students at the Berlin Academy, found that the best performers had accumulated about 7,410 hours by age 18. The number that gets cited is 10,000, and that number has been debated, but the precise threshold matters less than the scale of what we are talking about.
Children are spending four times Ericsson's figure on entertainment screens before they finish high school.
| Skill | Hours to Proficiency | Source |
|---|---|---|
| Concert-level piano | 10,000-15,000 | Ericsson et al., 1993 |
| Fluent in Mandarin | 2,200 | Foreign Service Institute |
| Fluent in Spanish | 750 | Foreign Service Institute |
| Professional software developer | 3,000-5,000 | Industry benchmarks |
| Olympic-track athlete | 8,000-15,000 | Training research |
| Chess master | ~11,000 (median) | Gobet & Campitelli |
A child could become a concert pianist, learn fluent Mandarin and Spanish, and still have 7,000 hours left over. Or train to competitive Olympic level in two sports while picking up two languages on the side. The Foreign Service Institute, which has been teaching diplomats languages for 70 years, estimates that 35,000 hours is enough to become fluent in every official United Nations language (Arabic, Chinese, French, Russian, and Spanish) with 22,000 hours to spare.
Nobody is suggesting children should practice violin for eight hours a day instead of watching YouTube. That is not the point. The point is that 35,000 hours is not a small number, and what fills those hours has consequences whether or not anyone is paying attention to the total.
What Kids Are Actually Doing on Screens
Only 3% of children's screen time goes to creative activities like coding, making music, or producing art, according to Common Sense Media. The other 86% breaks down into watching (TV, streaming, YouTube) at about 60% and gaming at 26%. The remaining fraction is social communication.
Three percent creative. Eighty-six percent consumption.
The screen time conversation is not really a conversation about screens. It is a conversation about what happens on them, and right now what happens on them for most children is watching other people do things.
Which Countries Have the Worst Childhood Myopia?
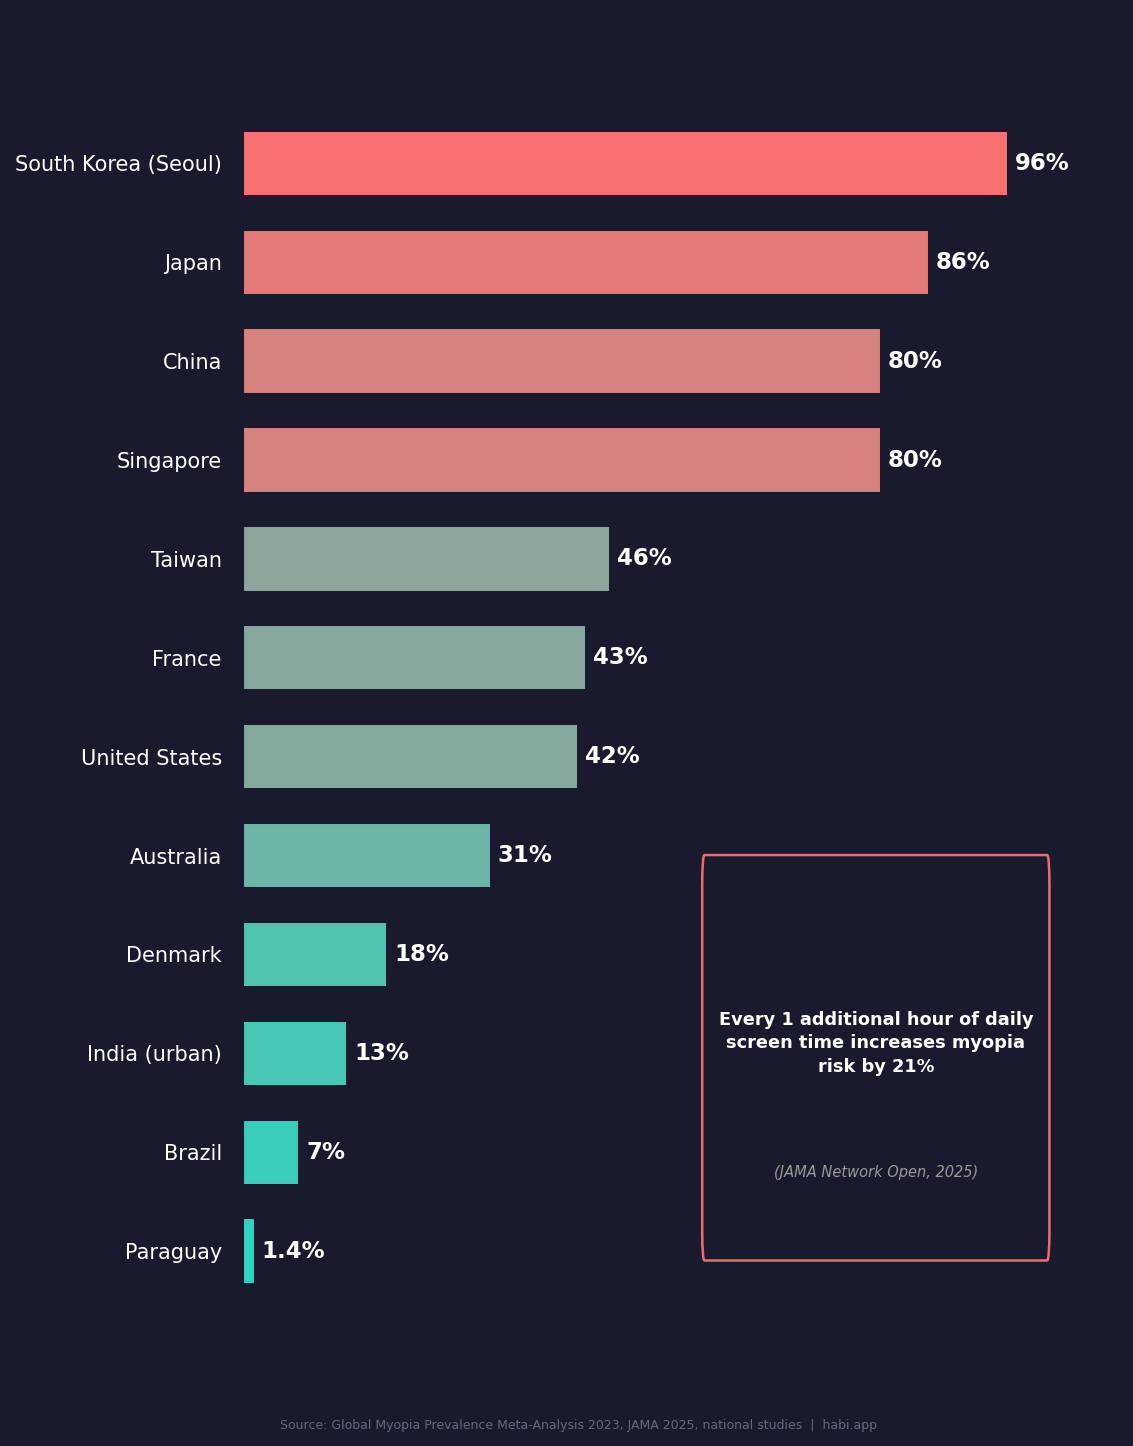
Everything above is about time. Time lost to screens, time not spent outside or reading or talking. But the myopia data makes the effects physical in a way you can measure with an eye chart. A 2025 JAMA Network Open meta-analysis covering 45 studies and 335,524 individuals found that every additional hour of daily screen time increases a child's odds of developing myopia by 21%. Four or more hours per day roughly doubles the risk.
In East Asia, where screen use among students is highest and outdoor time lowest, childhood myopia has gone from a medical concern to an epidemic. And it happened in a single generation.
| Country | Myopia Rate | Age Group |
|---|---|---|
| South Korea (Seoul) | ~96% | Young adults |
| Japan | ~86% | Teens (projected) |
| China | ~80% | End of high school |
| Singapore | 80% | 18-year-olds |
| Taiwan | 46% | Primary school |
| France | 43% | Ages 10-19 |
| United States | 42% | Ages 12-54 |
| Australia | 31% | 17-year-olds |
| Denmark | 18% | ~15 years |
| India (urban) | 13% | Schoolchildren |
| Brazil | 3-10% | Ages 6-17 |
| Paraguay | 1.4% | Ages 5-16 |
Sources: Global Myopia Prevalence Meta-Analysis 2023, BMC Ophthalmology, national studies.
South Korea went from roughly 20-30% childhood myopia in the 1980s to above 80% today. Genetics does not move that fast. The two drivers researchers keep pointing to are intensive near-work education systems and the collapse of outdoor time, both accelerated by screens.
But Taiwan managed to reverse its trend slightly, from 50% to 46% in primary schoolers, by mandating 120 minutes of daily outdoor time in schools. Outdoor time is protective. NPR reported that two hours per day outdoors significantly reduces myopia onset risk. The fix, in other words, is not complicated. It is just competing with a screen for a child's attention.
The Regulatory Response
Some countries are acting. China limits minors to one hour of gaming on weekdays, two on weekends. Australia became the first country to ban social media for children under 16 (effective December 2025). France banned phones in primary and secondary schools in 2018.
The United States has no federal screen time regulation for children.
Are Parents Modeling the Behavior They Worry About?
The conversation about children's screen time usually points in one direction. At kids. But the BLS American Time Use Survey tells a different story when you look at what parents are doing with their own hours.
Parents average about 30 minutes per day actively playing with or talking to their children. They spend 3 to 4 hours on personal, non-work screen time. That is a 7:1 ratio of personal screen time to meaningful child interaction.
Children notice.
According to Lurie Children's Hospital, 54% of children say their parents check phones too often. Thirty-two percent feel unimportant when parents are on their devices. Pew Research found that 68% of parents admit they are at least sometimes distracted by their phone around their kids. Seventeen percent say it happens "often."
Children Copy What They See
A nationally representative study of 2,300+ parents of children ages 0-8 found that parent screen time is the single strongest predictor of child screen time. Not rules. Not conversations about screen time limits. The parent's own behavior. If parents watch TV four or more hours per day, their sons are 10.5 times more likely to do the same. Daughters, three times.
A 2024 study published in JAMA Pediatrics measured what happens to household language when screens are on, using LENA speech recognition technology. Every one minute of screen time was associated with seven fewer adult words spoken, five fewer child vocalizations, and one fewer conversational turn. At the WHO-recommended limit of one hour per day for toddlers, that means children miss up to 397 adult words, 294 of their own vocalizations, and 68 conversational turns.
Every single day.
Jonathan Haidt, social psychologist at NYU's Stern School of Business and author of The Anxious Generation, has framed the broader shift this way: the transition from a play-based childhood to a phone-based childhood happened in the early 2010s, and adolescent mental health plunged in the years that followed. Rates of depression, anxiety, self-harm, and suicide among adolescents rose sharply, more than doubling on many measures. The timing alone is not proof. But the overlap between the smartphone adoption curve and the mental health decline curve is difficult to explain away, and nobody has managed to do so convincingly.
Full Methodology
Screen Time Calculation
We used daily entertainment screen time averages by age bracket from Common Sense Media census reports (the 2020 report for ages 0-8, the 2021 report for ages 8-18, and the 2025 update for ages 0-8). These surveys explicitly exclude school-related and homework screen use. Daily averages were multiplied by 365 days per year and then by the number of years in each bracket. Screen time occurs on weekends, holidays, and summers (likely at higher rates than on school days), making the 365-day multiplier conservative for most age groups.
Age brackets used: 0-1 (49 min/day, 2 years), 2-4 (2h 30m/day, 3 years), 5-7 (3h 05m/day, 3 years), 8-12 (5h 33m/day, 5 years), 13-18 (8h 39m/day, 6 years). Total: ~35,000 hours.
School Hours Calculation
We used OECD Education at a Glance data, which reports approximately 1,000 instructional hours per year for U.S. primary and secondary schools. Multiplied by 13 years of K-12 education: ~13,000 hours. The more generous figure of ~16,000 hours uses 180 school days at 7 hours including all in-building time.
Other Activity Estimates
Outdoor play, reading, sports, family meals, homework, and face-to-face socializing estimates come from the sources cited in each section. Where ranges exist (e.g., outdoor play 4,000-6,000 hours), we used the midpoint for the "combined" comparison. Even using the upper bounds for every competing activity, the combined total (~30,000 hours) remains below entertainment screen time (~35,000 hours).
Myopia Data
Country-level myopia rates come from the 2023 global myopia prevalence meta-analysis and individual national studies. The dose-response relationship (21% per hour) comes from the 2025 JAMA Network Open meta-analysis of 45 studies covering 335,524 individuals.
Limitations
The Common Sense Media tween and teen data is from 2021, collected during the pandemic when screen use was elevated. The next census update may show different numbers. Screen time is self-reported (though anchored to device Screen Time reports in some surveys), and research suggests people tend to underestimate their screen use rather than overestimate it. The 35,000-hour figure assumes current averages hold across a full childhood. If screen time continues to rise (as it has for two decades), the real number will be higher. If cultural shifts reduce it, it may be lower.
All calculations, sources, and assumptions are documented above. If you'd like to use our data or graphics in your publication, please link back to this article.
Frequently Asked Questions
How much screen time does the average child get per day?
According to Common Sense Media's census data, average daily entertainment screen time by age is: under 2, about 49 minutes; ages 2-4, 2 hours 30 minutes; ages 5-7, 3 hours 5 minutes; ages 8-12 (tweens), 5 hours 33 minutes; ages 13-18 (teens), 8 hours 39 minutes. These figures exclude all schoolwork and homework screen time.
How many total hours do children spend on screens before age 18?
Based on Common Sense Media's 2020 and 2021 census data, children accumulate approximately 35,000 hours of entertainment screen time from birth to age 18. That is almost three times the roughly 13,000 hours of K-12 classroom instruction. It also exceeds the combined total of school, outdoor play, reading for pleasure, organized sports, family meals, and homework.
Is children's screen time linked to nearsightedness?
Yes. A 2025 JAMA Network Open meta-analysis of 45 studies and 335,524 individuals found that every additional hour of daily screen time increases the odds of myopia (nearsightedness) by 21%. Children who spend four or more hours per day on screens have roughly double the risk. In East Asian countries where screen use is highest, childhood myopia rates now exceed 80%. Outdoor time appears protective, with two hours per day outdoors significantly reducing onset risk.
How does children's screen time today compare to the 1990s?
In 1995, children averaged about 3 hours per day of screen time, almost entirely shared television. By 2025, tweens average 5 hours 33 minutes and teens average 8 hours 39 minutes, mostly on personal devices used alone. Outdoor play has dropped from roughly 2 hours per day to as little as 7 minutes of unstructured play. Teens who see friends in person "almost daily" fell from 52% in the late 1970s to 28% by 2017.
Do parents spend more time on screens than with their kids?
According to BLS American Time Use Survey data, parents spend about 30 minutes per day actively playing with or talking to their children, while averaging 3-4 hours of personal (non-work) screen time. That is roughly a 7:1 ratio. Pew Research found 68% of parents admit to being at least sometimes distracted by their phone around their children, and 54% of children say their parents check phones too often.
What You Can Do About It
None of this data argues that screens are poison. Some screen time is educational. Some of it is genuinely social. The problem is not screens. It is the volume, the passivity of 86% of it, and the fact that 35,000 hours accumulated without most families noticing the total.
Knowing the number makes it possible to set specific targets instead of arguing about vague limits. Even reclaiming 30 minutes a day recovers 182 hours a year. That is roughly equivalent to adding an entire month of daily outdoor play back into a child's life.
Use our screen time calculator to see what the numbers look like for your child's specific age. And if you want a simple way to start tracking screen time for your family, Habi tracks screen time habits alongside other daily routines. One tap to log. Visual progress. No guilt. Free on the App Store.